
Application Background
Processes such as grinding, thin-film deposition, bonding, and heat treatment can alter the height distribution across the surface of a silicon wafer. In industrial settings, there is often a need to rapidly obtain a scanned profile using non-contact sensors. However, polished silicon acts as a highly specular (mirror-like) surface, and the act of securing the wafer onto a stage can alter its shape. Without clearly defining the measurement state and the reference plane, the measured maximum-to-minimum height difference is frequently—and incorrectly—labeled as "warp."
Customer Pain Points
Specular reflections are highly sensitive to the orientation of the probe; even a slight change in the angle of the wafer can lead to signal saturation, insufficient light return, or a localized loss of the tracking signal.
Different mechanical constraints—such as vacuum chucking, three-point support, or free-standing placement—result in different surface shapes; therefore, the same acceptance criteria cannot be applied across these varying conditions.
Scan data inherently includes the wafer’s shape, the straightness of the motion stage, mounting tilt, and vibrations. Simply taking the peak-to-valley value would incorrectly incorporate mechanical errors into the final result.
If sampling points are too sparse, edge exclusion zones are poorly defined, or the scan trajectory is not synchronized with the wafer's position, localized deformations may be missed or sampled redundantly.
Measurement Solution
The target should first be defined as a "single-sided height map under a controlled clamping state." This requires establishing a stage reference, verifying the specular reflection, and triggering the scan based on the wafer's position. If a project requires the reporting of "bow" or "warp" in a free-standing state, the methodology must be upgraded to include dual-sided synchronous measurement—compliant with established standards—along with corrections for the effects of gravity and support mechanisms. A simple height difference measured by a single probe is not an acceptable substitute.
Distinguishing Between Surface Height, Flatness, and Bow/Warp
A single-probe laser triangulation sensor measures the variation in distance between the probe and the top surface of the wafer. By subtracting the stage trajectory and the reference plane, one can generate a surface height map, which is suitable for comparing changes before and after a process, provided the clamping conditions remain consistent.
The SEMI MF1390 standard defines "bow" and "warp" based on the median plane of the wafer, utilizing dual probes to observe both sides simultaneously—thereby minimizing interference from thickness variations. Meanwhile, the "flatness" of a constrained front surface, as discussed in SEMI MF1530, represents a distinct geometric parameter. Consequently, project documentation must explicitly specify the measurement state, the reference plane, and the precise terminology for the geometric parameter being evaluated. Measurement Configuration and Mounting
Secure the ST-P probe to a rigid fixture that is mechanically decoupled from the motion stage. Place the wafer on a clean, repeatable positioning stage or a designated support structure. Adjust the orientation of the emitter and receiver—performing a fine-angle search based on the reflected light—to ensure a stable, valid signal is maintained throughout the entire scanning path.
Begin by scanning a traceable flat reference or the empty stage to determine the stage’s straightness and any mounting tilt. During actual sampling, ensure the probe, fixture, stage, and cables remain undisturbed; prevent cable drag, which could introduce periodic vibrations into the profile data.
Validate the process using representative samples, including bare wafers, film-coated wafers, and patterned wafers.
Clearly define the wafer orientation, notch/flat position, edge exclusion zones, and support method.
Record valid signal indicators alongside distance values; do not use interpolation to mask instances where the signal is lost.
Measurement Procedure
Warm up the system in a stable environment and record baseline scans of the reference plate and the stage. Load the wafer and execute a scan pattern—such as a cross, concentric circles, or a grid—mapping distance values to spatial coordinates using encoder positions or equidistant triggering.
During data processing, remove points where the signal was lost, subtract the stage baseline, and fit a reference plane according to the specified criteria. Generate a height map, the ratio of valid data points, the peak-to-valley (PV) value, and the repeatability (variation between repeated scans). Retain the raw data for future verification.
Perform baseline scans and verify the signal window.
After loading the wafer, check the support and vacuum-clamping status.
Synchronize data acquisition with positional data and save the raw coordinates.
Apply baseline compensation, reference plane fitting, and edge-exclusion rules.
Repeat the measurement at least three times to assess result stability.
Selection Considerations
The measurement range must encompass the total variation—including the wafer’s inherent shape, stage height fluctuations, and mounting tolerances—rather than just the expected warpage value. A small spot size is suitable for bare wafers and fine features, while patterned surfaces require an evaluation of reflected light variations; in such cases, consider using a wider-spot configuration if necessary.
The required sampling rate is determined by both the stage speed and the spatial step size. The ST-P series backend system supports high-speed sampling, Ethernet, RS485, and analog output. However, the actual achievable frequency depends on the specific model selected, the nature of the surface echo, and the performance of the entire system, including its interface links.
Reference Distance and Mechanical Clearance
Measurement Range, Target Detection Threshold, and Safety Margin
Reflection Characteristics of Bare Die or Film-Coated Surfaces
Minimum Spatial Feature Size and Scanning Step
On-Site Considerations and Operational Boundaries
Specular silicon surfaces, transparent film layers, patterned regions, and beveled edges can all alter the reflection path; therefore, stable measurement across the entire surface cannot be guaranteed without prior sample testing. Factors such as cleanroom airflow, stage acceleration/deceleration, vacuum chucking, and thermal drift may also affect results; these conditions should be documented in the acceptance records.
Single-sided scanning is suitable for process control and relative topographical comparison. If a comparison with standard metrology equipment is required, parameters—such as the sample’s constraint state (free vs. fixed), reference plane definition, edge exclusion zones, gravity compensation methods, and statistical calculation criteria—must be standardized before conducting a correlation study.
Verification and Acceptance
Testing should be performed using wafers with varying degrees of warpage, different film layers, and from different production batches. Evaluations should include repeatability, re-clamping (re-loading) tests, and daily drift assessments. When comparing results against established wafer geometry metrology data, one should not rely solely on a single numerical value; instead, the trends in the height map and the locations of any outliers must also be analyzed.
The acceptance report must specify the probe orientation, stage speed, trigger method, filter settings, reference plane algorithm, and the raw data files. Only when these conditions are consistent can subsequent SPC (Statistical Process Control) trend data be considered comparable. Repeat-Scan Variance
Reproducibility After Re-mounting
Valid Data Point Ratio and Signal-Loss Distribution
Reference Plate Drift (Pre- vs. Post-Measurement)
Product Specifications
Model Reference
ST-P25: Reference distance 25mm, measurement range ±1mm, repeatability 0.05μm, linearity error < ±0.6μm
ST-P30: Reference distance 30mm, measurement range ±5mm, repeatability 0.15μm, linearity error < ±3μm
ST-P50: Reference distance 50mm, measurement range ±10mm, repeatability 0.25μm, linearity error < ±4μm
ST-P80: Reference distance 80mm, measurement range ±15mm, repeatability 0.5μm, linearity error < ±6μm
ST-P150: Reference distance 150mm, measurement range ±40mm, repeatability 1.2μm, linearity error < ±16μm
Technical Advantages
Non-contact acquisition eliminates probe-induced pressure, protecting thin, fragile wafers and pristine surfaces.
Position-synchronized scanning generates a comprehensive height map, rather than relying on a limited number of discrete points.
Data—including platform baseline, raw distance, and final results—is stored in layers, facilitating the traceability of system-related errors.
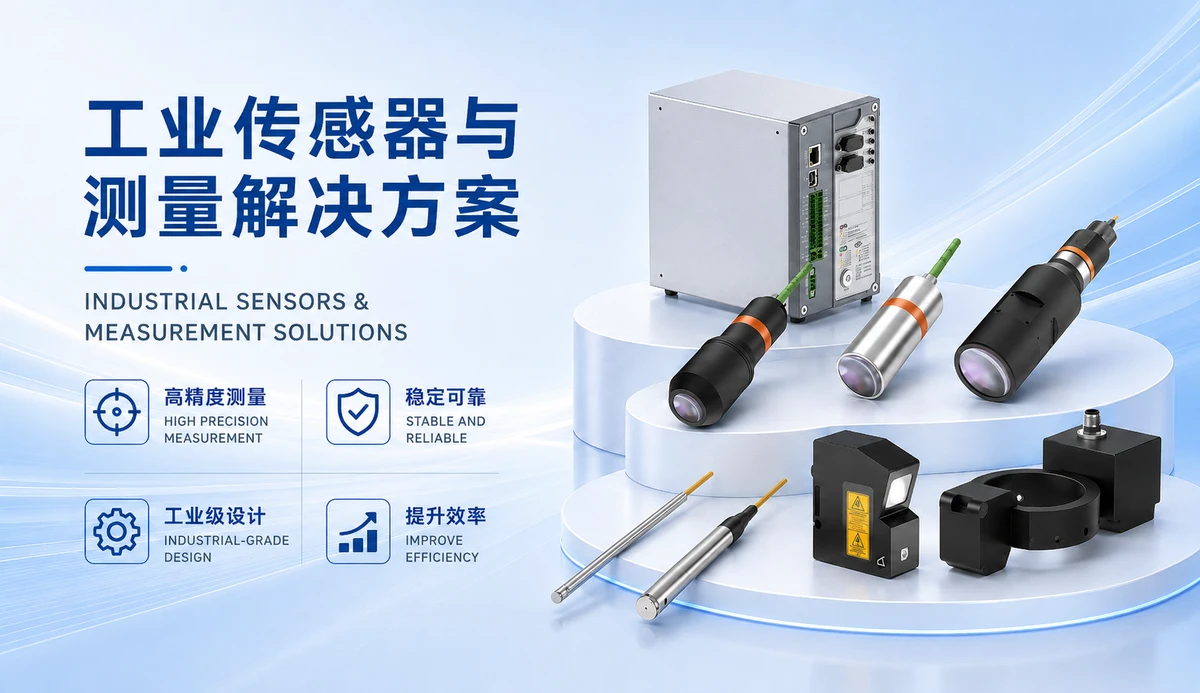
The ST-P series offers various reference distances and measurement ranges, allowing for selection based on available installation space and process requirements.
Frequently Asked Questions
Does the peak-to-valley difference measured by a single probe represent the wafer "warp"?
No. It is, strictly speaking, a single-sided height difference under a specific mounting configuration and reference plane. Terms such as "warp" or "bow" should only be applied once the measurement setup, support-related corrections, and algorithms align with established standards and have been validated for correlation.
Can a probe be mounted vertically (perpendicularly) over a mirror-finish wafer?
This cannot be guaranteed a priori. Since the laser triangulation receiver path depends on the reflection angle, one must determine the optimal orientation using representative samples—such as bare wafers, film-coated wafers, or patterned wafers—and verify that the entire scanning path remains free from signal saturation or loss.
Should a cross-pattern or a grid-pattern scanning path be chosen? The choice depends on the smallest spatial features to be detected and the sampling interval (or "beat"). A cross-pattern path is suitable for rapid trend monitoring, while a grid pattern provides more comprehensive coverage; in both cases, edge exclusion zones must be defined and synchronized with position-based triggering.